
Announcement Center
ETH Enters a ‘Buy Zone’?
BITGP
2025-11-19 11:55

Ethereum just entered one of its most interesting phases of 2025: price dropping sharply, sentiment turning fearful, yet long-term indicators quietly flashing “buy the dip.”
Meanwhile, conservative traders are sticking to the classic strategy: wait and watch.
Let’s break down what’s really happening.
ETH Drops to $3,000 — Short-Term Downtrend but Long-Term Signals Strength
In November, ETH fell nearly 20%, sliding from $3,900 down to the $3,000 level — a price last seen in July.
This drop pushed ETH into a clear daily downtrend, marked by consecutive lower highs and lower lows.
From a short-term technical view, that’s not great.
But zoom out a little, and you’ll see something different: accumulation signals are starting to flash.
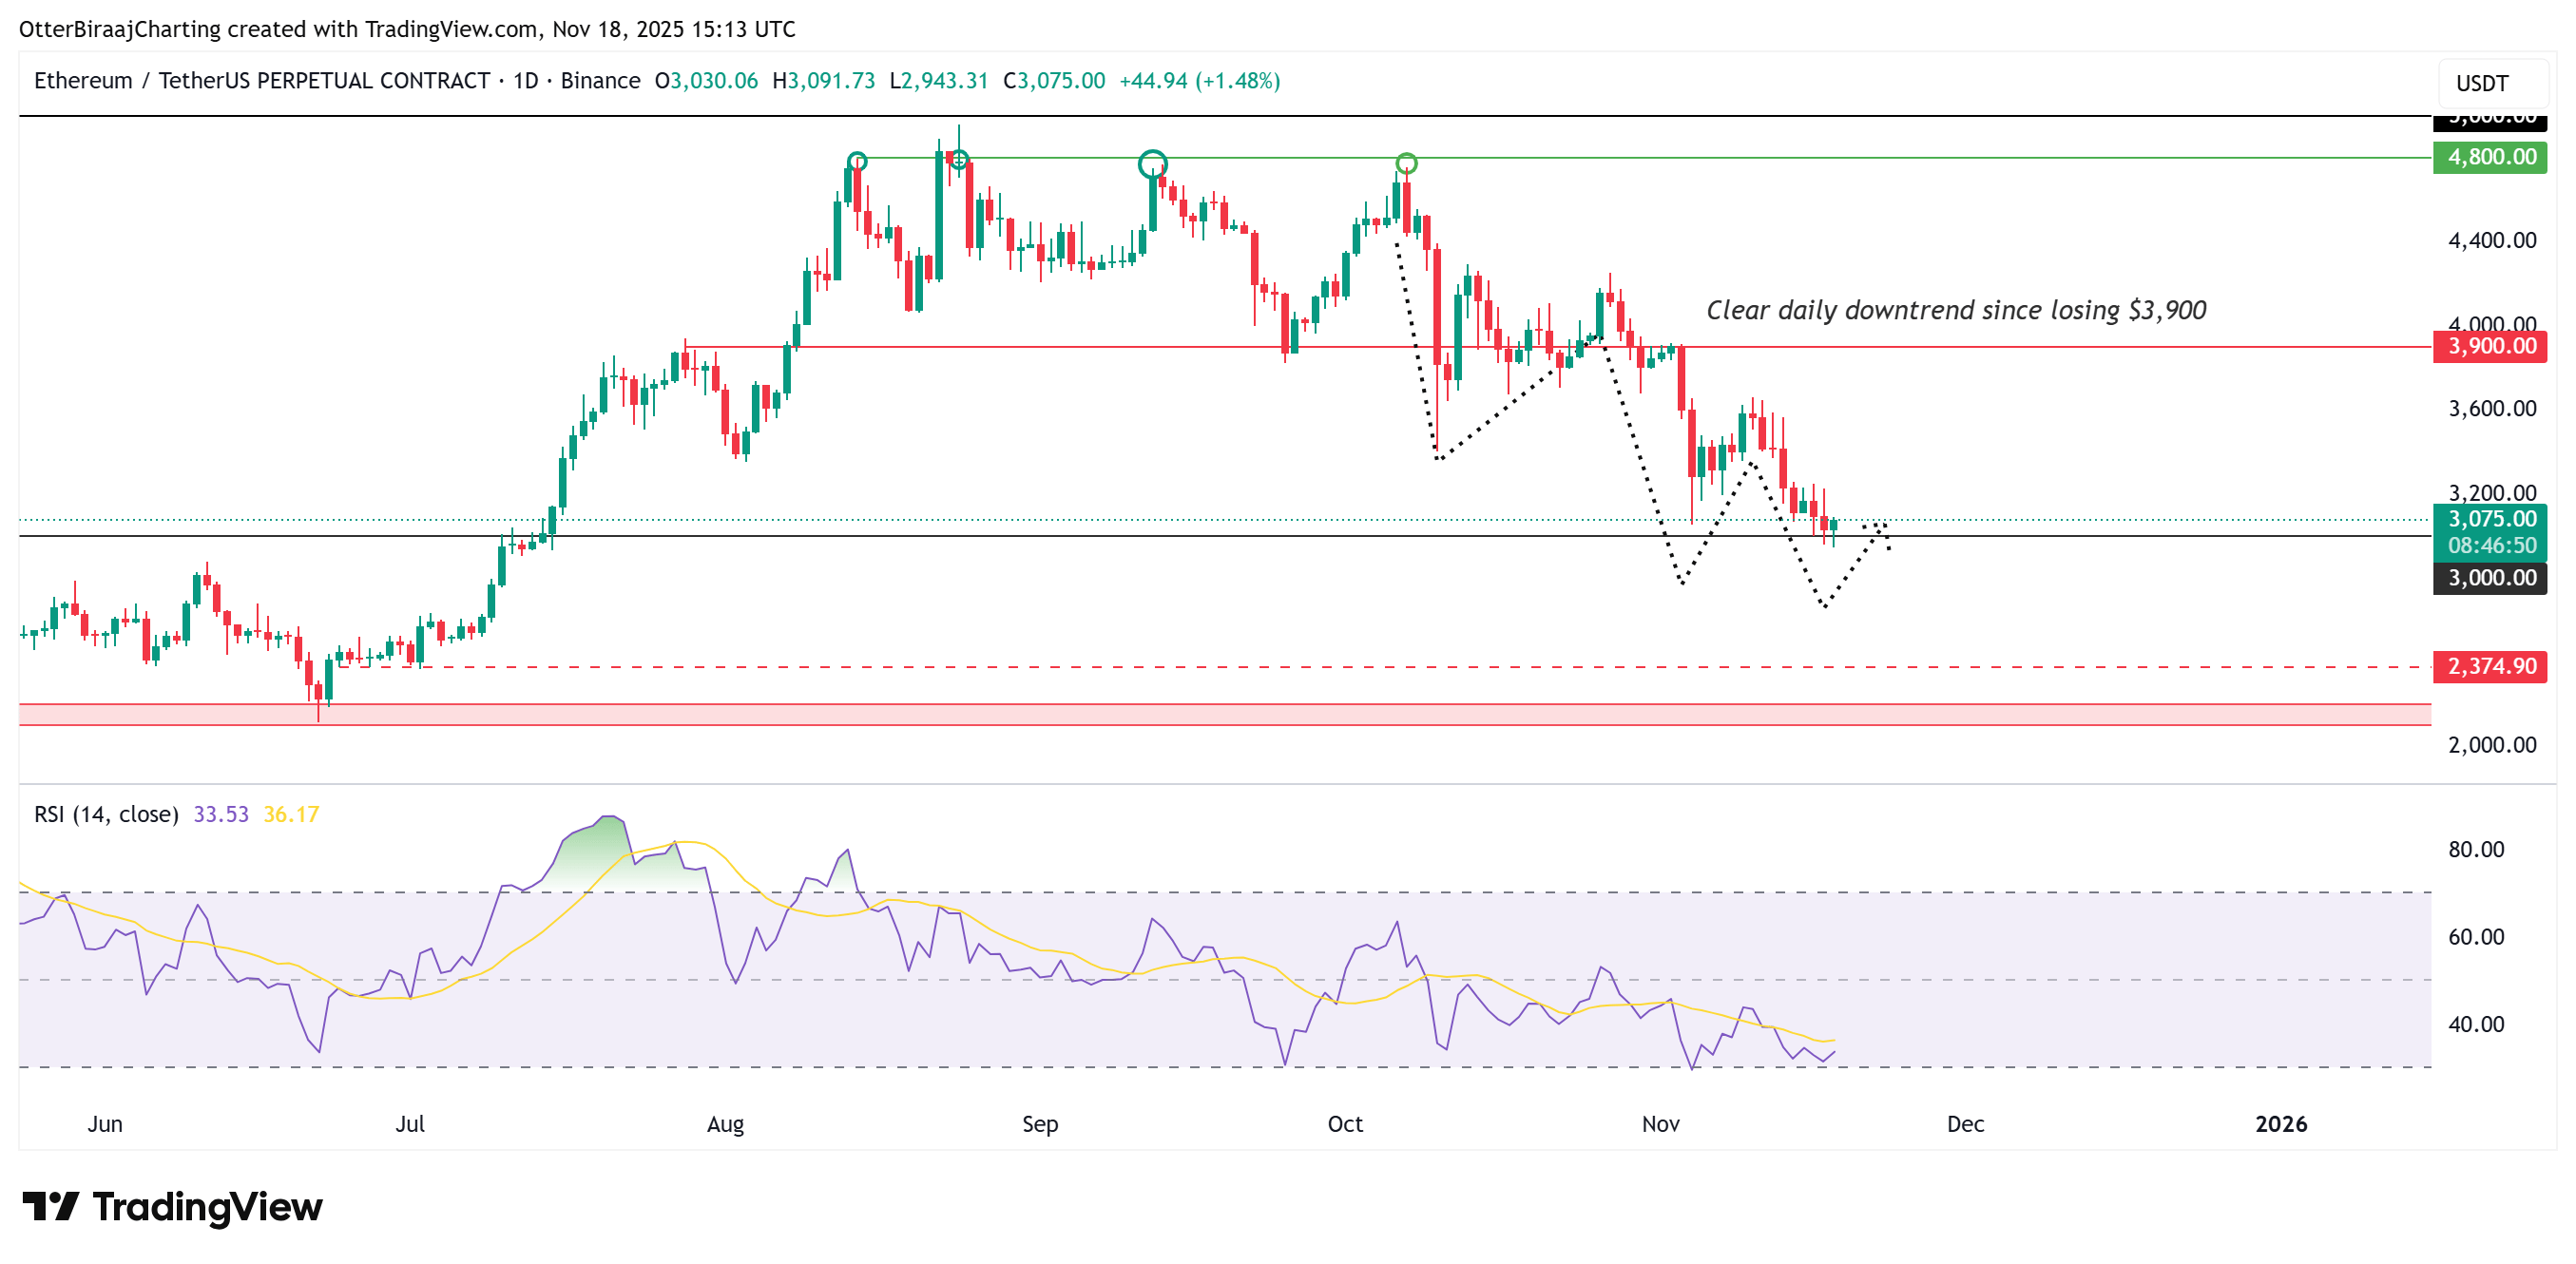
Ether one-day chart. Source: Cointelegraph/TradingView
Mayer Multiple Drops Below 1 — Why This Is a Bullish Long-Term Signal
To understand why analysts aren’t panicking, look at one of the most respected long-term indicators: the Mayer Multiple (MM).
What Is the Mayer Multiple?
It measures:
-
Current ETH price
-
Divided by the 200-day moving average
When MM falls below 1, ETH is trading at a discount to its long-term trend — historically a powerful buy zone.
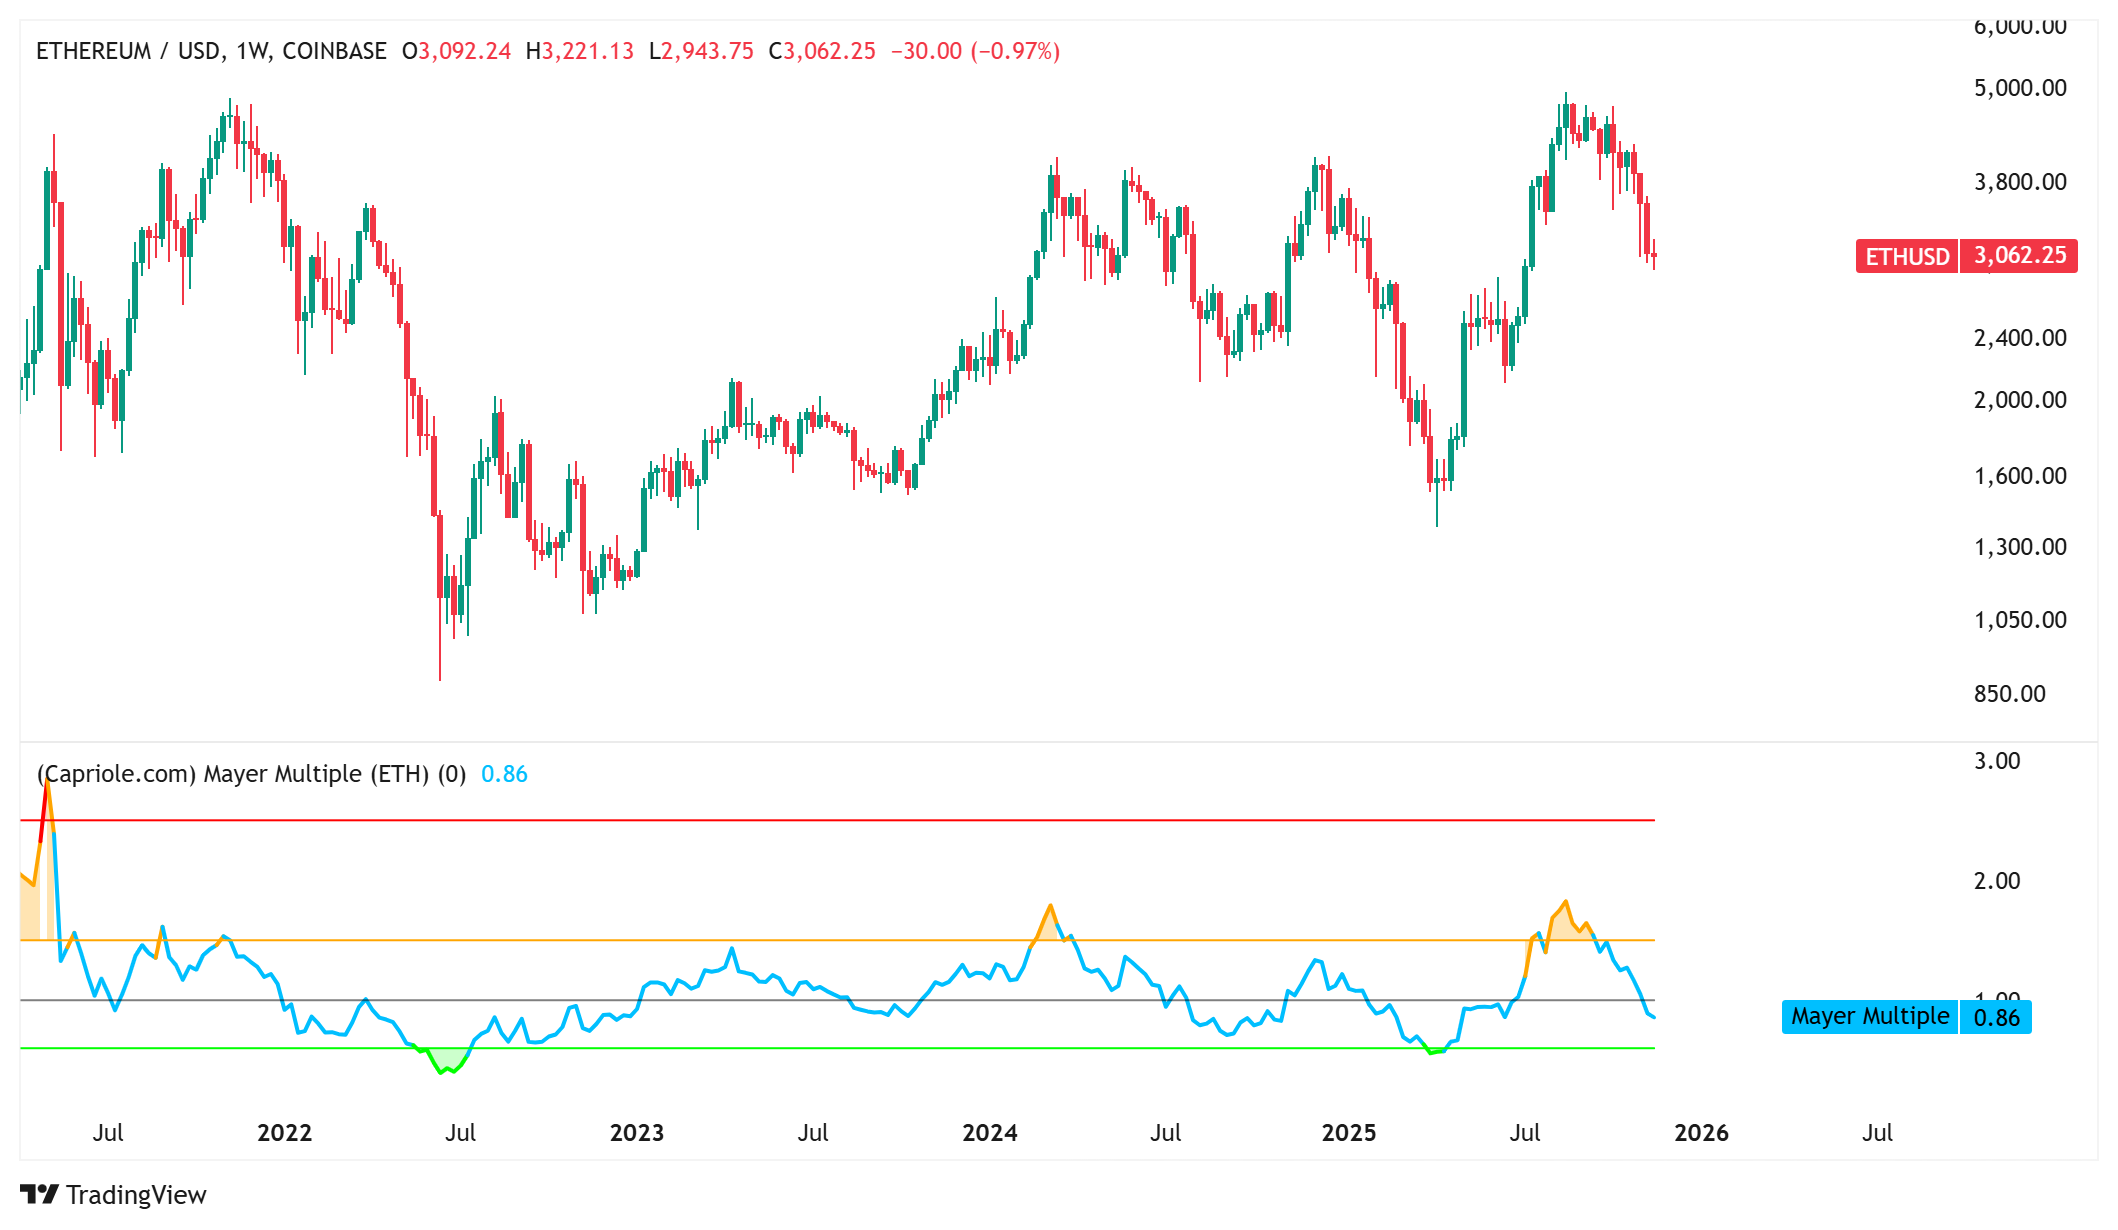
Ether’s Mayer Multiple dropped below 1. Source: Capriole Investments
ETH Re-Enters the Historical Buy Zone
ETH’s Mayer Multiple dipped below 1 for the first time since June.
Historically, this level has aligned with:
-
Market bottoms
-
Major accumulation phases
-
Multi-month recoveries
The only major exception was January 2022, during the deep bear market.
But today’s environment looks much more like early-cycle reset, not a structural collapse.
Translation:
ETH is closer to opportunity than danger.
Liquidity Reset Suggests More Short-Term Volatility Ahead
Despite strong long-term signals, short-term price action remains fragile.
Data from Hyblock Capital shows that ETH still sits above several thick liquidity clusters, indicating potential volatility before stabilizing.
Key Liquidity Clusters Below ETH
According to Hyblock, after the $3,000 sweep, the next major zones are:
-
$2,904 – $2,916
-
$2,760 – $2,772
These zones often act like magnets — especially during periods when the market wants to “clean up” leverage before moving higher.
Altcoin Vector: Liquidity Structure Fully Reset
Altcoin Vector notes that ETH’s liquidity structure is now fully reset, a condition that tends to precede major long-term bottoms.
Two possible paths:
-
Liquidity rebuilds quickly → ETH may begin a new expansion phase.
-
Liquidity takes longer to recover → ETH stays vulnerable to short-term dips.
Either way, the groundwork for a long-term recovery is forming.
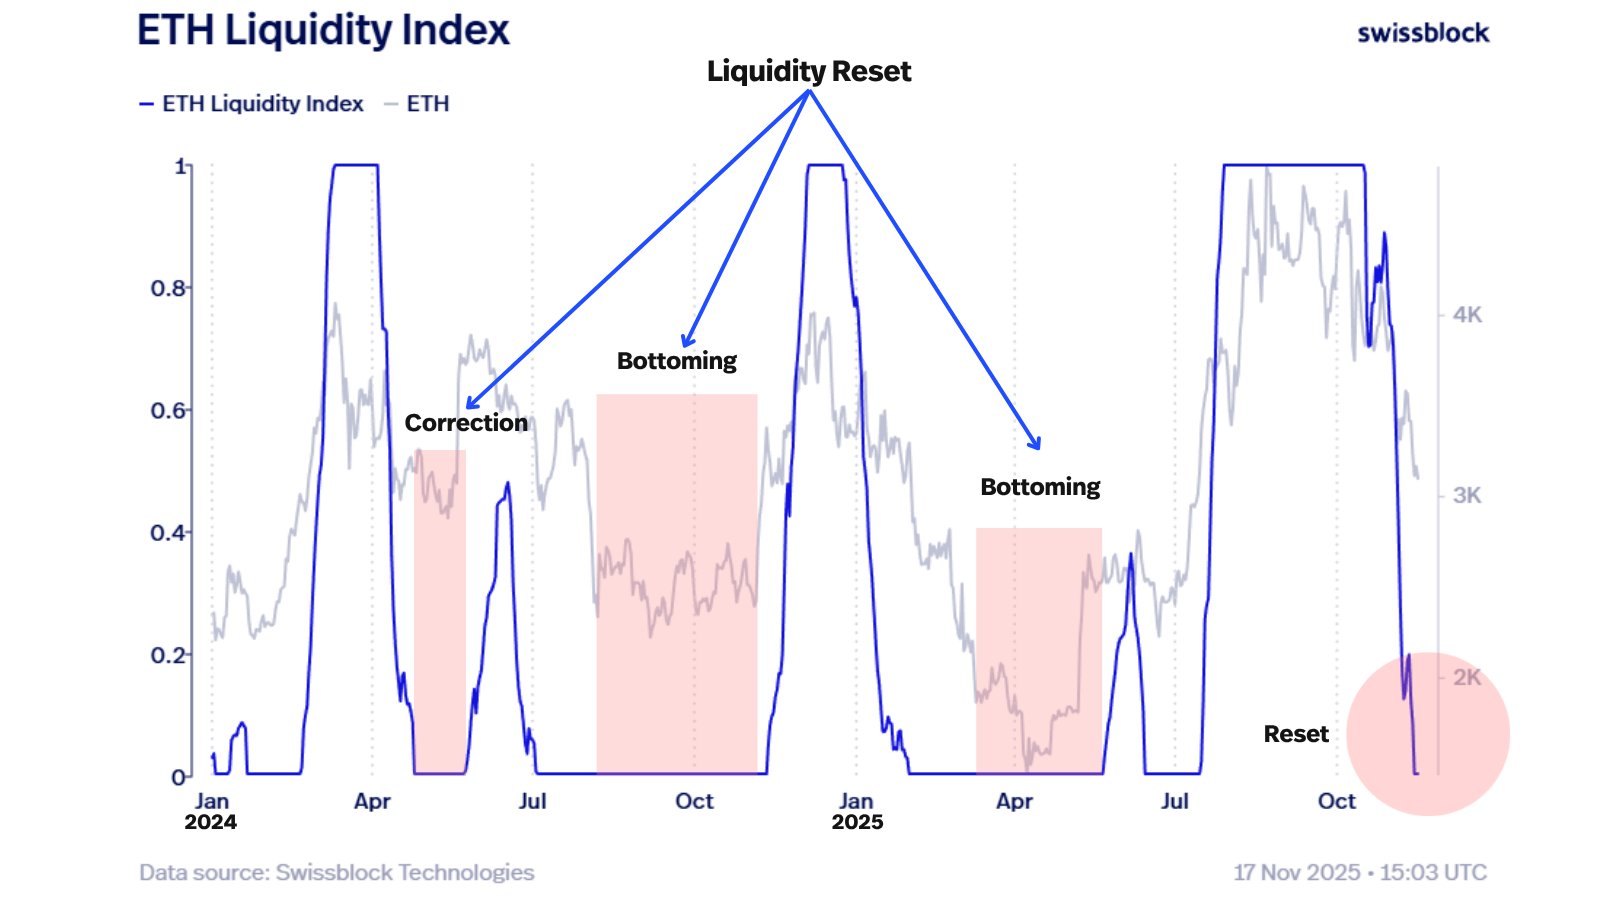 Ether liquidity index. Source: Altcoin Vector/X
Where Does ETH Stand in the 2025 Cycle?
Combining the signals:
-
Mayer Multiple < 1
-
Deep liquidity clusters
-
Short-term weakness
-
Long-term strength
We get a clear picture:
➡️ Short-term: volatility remains high
➡️ Long-term: ETH is in one of its best accumulation zones of the year
Short-term traders may feel uneasy.
Long-term investors see opportunity.
Investor Takeaways (Not Financial Advice 😄)
-
Short-term traders: watch the liquidity zones closely.
-
Long-term investors: MM below 1 has historically been a strong signal.
-
Volatility-averse holders: observing from the sidelines is still a strategy.
Conclusion — Think Long-Term, Stay Disciplined, Be Patient
ETH’s market structure suggests:
-
Short-term noise
-
Long-term opportunity
-
A cycle reset in progress
History shows that moments like these often become the best accumulation periods.
Stay patient, stay disciplined, and keep a long-term mindset.